Getting Things Done
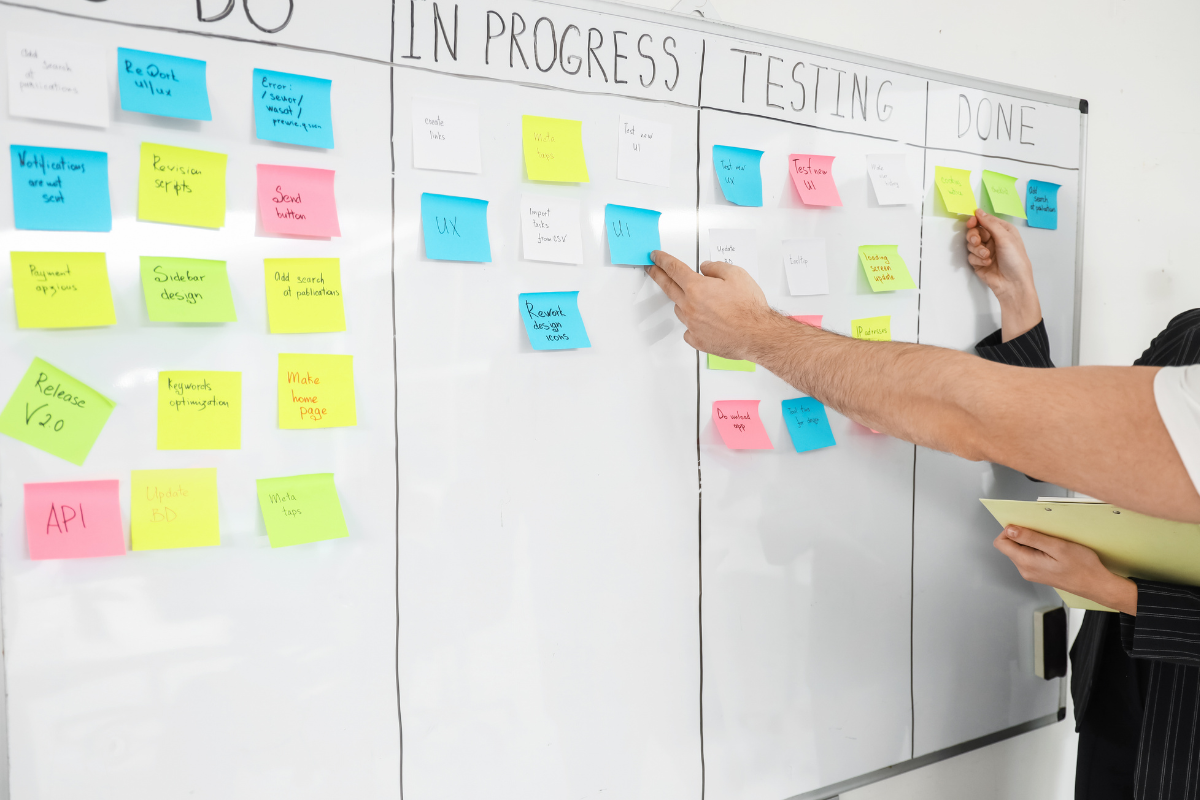
Kanban boards organize work by representing each work item as a card that moves across columns like “To do,” “In progress,” and “Done.” The board’s main job is to make workflow visible, so you can spot delays and reduce idle time between steps. A common evidence-based observation from software and operations teams is that limiting work in progress (WIP) reduces multitasking and often shortens cycle time, because fewer items compete for attention. Another widely cited operational metric is throughput, the number of completed items per time period; teams track it to see whether changes improve flow.
Skip the fantasy of perfect planning. The board handles reality instead.
Work systems now mix office tasks, customer requests, and learning deliverables, and that mix pushes teams toward continuous intake rather than one-time project bursts. In parallel, online learning has shifted toward frequent assessment, peer feedback, and iterative revisions, which creates repeated “start, review, revise, submit” loops. Kanban fits these loops because each card can represent a single deliverable step, not a vague “project.”
In practice, a card might be “Draft module 3 quiz,” then “Peer review,” then “Revise explanations,” then “Submit.” You can also model non-learning work, like “Vehicle inspection report,” “Parts order,” and “Customer follow-up,” using the same mechanics.
Version 2.0 boards help. They force clarity.
Main problems or pain points
People often treat a Kanban board like a prettier to-do list, then wonder why nothing improves. A to-do list records intent; a Kanban board records flow, so it needs explicit column meanings and a way to control WIP. When columns stay vague, cards drift, and “In progress” becomes a parking lot. That hides bottlenecks because the board shows movement, not waiting time.
Skip the “move cards fast” habit. It hides queues.
Another common failure comes from mixing different types of work in the same column without defining entry and exit criteria. For example, “Write lesson” and “Fix broken link” share a column, but they require different review steps and different turnaround times. The result is uneven load, and the board stops reflecting the real system. You may also see a mismatch between data sources: intake arrives via email, work updates happen in a spreadsheet, and the board lags behind by 2–3 days, which makes cycle-time measurements unreliable.
Real-world consequences show up quickly. If a team limits WIP to 3 cards but still accepts 10 new requests, the board becomes a backlog dump, and stakeholders interpret “no movement” as “no progress.” In learning contexts, that looks like students starting many drafts, then waiting for feedback, then revising late. The board can reveal that pattern, but only if you track when a card enters “In progress” and when it exits.
Data flow matters more than opinions. The board needs timestamps.
Solutions and recommendations
Define column meanings
Write a one-sentence definition for each column that answers: what must be true for a card to enter and what must be true to leave. “In progress” should mean active work, not “not done yet.” “Review” should mean a specific reviewer has the card and a response deadline exists. This works because Kanban relies on shared interpretation; if the team disagrees on definitions, the board becomes a subjective status report.
In practice, you can start with 3–5 columns and add more only when you see consistent waiting between steps. A simple rule: if two cards spend different amounts of time in the same column, the column definition probably needs refinement. Tools like Jira, Trello, or GitHub Projects can represent columns, but the definitions live in your team agreement, not in the software.
Skip vague labels. They create false motion.
Set WIP limits per column
Choose a WIP limit for “In progress” and any other columns that represent active work. WIP limits work because they reduce context switching and force the team to finish before starting new items. A practical starting point is 1–3 cards per person or 3–5 cards per small team, then adjust after you observe queue behavior for 2–4 weeks. If you set WIP to 20, the board stops controlling load and becomes a visual inventory.
In practice, when a column hits its WIP limit, new cards stay in “To do” until capacity frees up. This creates a visible constraint that stakeholders can plan around. Some teams also set a WIP limit for “Review” to prevent reviewers from becoming overloaded, which can reduce feedback delays.
Limit WIP to reveal bottlenecks. Otherwise you guess.
Track cycle time and throughput
Measure cycle time as the elapsed time from when a card enters “In progress” to when it reaches “Done.” Track throughput as completed cards per week, not per day, to reduce noise from small sample sizes. This works because flow metrics reflect the system, not effort. If cycle time rises while throughput stays flat, you likely have more waiting or rework.
In practice, you can compute cycle time manually from timestamps for 30–50 cards, then graph weekly throughput. Many teams use built-in analytics, but you still need consistent “Done” criteria. For learning deliverables, “Done” might mean “submitted with rubric pass” rather than “draft finished,” or your cycle-time data will mix different quality thresholds.
Skip vanity metrics. They ignore waiting.
Make policies explicit
Policies describe how work moves: when a card can move forward, how exceptions get handled, and what “ready” means. For example, a policy might state: “A card enters ‘Review’ only after it includes citations and meets the rubric checklist.” This works because it reduces rework and prevents cards from bouncing between columns due to missing inputs.
In practice, keep policies short and test them. If you add a checklist and cycle time drops by 10–20% over a month, you learned something about your process. If cycle time stays flat, the checklist may not match the real failure points, and you’ll need to observe where cards stall.
Write policies like rules. Not like wishes.
Use classes of service
Different work types need different service levels. “Urgent safety recall analysis” and “monthly report formatting” should not share the same queue rules. Classes of service work because they prevent one work type from starving another and they make trade-offs visible when intake spikes.
In practice, you can create separate lanes or separate boards for work categories, or add a “Class” field that changes WIP limits and expected review times. A mild caution: too many classes can fragment the system and reduce your data quality, so start with 2–3 classes and refine after you see stable patterns.
Separate work types early. Otherwise priorities blur.
Limit intake and manage queues
Kanban boards improve when intake matches capacity. If new cards arrive faster than throughput, the “To do” column grows and stakeholders experience delays even if the team works hard. This works because it forces planning around flow: you can cap intake per week or require a minimum “ready” state before a card enters the board.
In practice, you can run a weekly replenishment meeting where you pull only enough cards to keep “In progress” near WIP limits. For online learning, that might mean limiting the number of active assignments per course to 2–3 so feedback cycles do not overlap. If you do not control intake, cycle time becomes a measure of backlog growth, not process quality.
Control intake, then measure. Otherwise you chase noise.
Visualize blockers and dependencies
Use a consistent way to represent blocked work, such as a “Blocked” label or a dedicated column that triggers an escalation policy. This works because blocked cards create hidden queues; without explicit blockers, the board looks healthy while work waits on approvals, data, or external responses. Dependencies also matter in learning workflows: a draft cannot move to review without rubric alignment, source materials, or peer availability.
In practice, require a short blocker note with an owner and a target date. If you see blocked cards averaging 5–7 days, you can target the dependency source rather than adding more effort. Tools that support card-level fields help, but the key is consistent use and follow-up.
Show blockers plainly. Hidden waits cost time.
Review the board with a fixed cadence
Run a short review cadence that focuses on flow and policy adherence, not status theater. A weekly review can examine throughput trends, top bottleneck columns, and cards that exceeded a cycle-time threshold. This works because it turns the board into a feedback loop for the system, not a dashboard for reporting.
In practice, you can set a rule: if a card exceeds 14 days in “In progress,” the team must either resolve the blocker, adjust the policy, or re-scope the work. Some teams also do a daily 10-minute standup that only covers blocked cards and WIP limit breaches, which reduces meeting time.
Review weekly, not endlessly. Otherwise you drift.
Case examples
Online course revision workflow
A learner managing a multi-week course uses a Kanban board with columns: To do, In progress, Peer review, Revision, Done. They set WIP limit to 2 cards in “In progress” and 1 card in “Peer review,” because feedback turnaround varies. Over 3 weeks, they notice cycle time spikes when “Peer review” exceeds 5 days, and they add a policy: peer review starts only after the draft includes a rubric checklist. Throughput stabilizes, and the learner stops starting new drafts while waiting for feedback.
Skip the “start everything” plan. Feedback queues punish it.
Service shop work intake
A small vehicle service shop tracks work orders on a Kanban board with columns: Intake, Diagnostics, Parts wait, Repair, QA, Done. They treat “Parts wait” as a visible queue with a WIP limit of 4, since technicians can only stage so many jobs. When throughput drops, the board shows that “Parts wait” grows faster than “Diagnostics,” which points to supplier lead times rather than technician capacity. The shop adjusts intake by scheduling fewer new diagnostics when parts lead times rise, then cycle time returns toward baseline after 2–3 weeks.
Parts delays drive the board. Not effort alone.
Comparison table or checklist
| Approach | What it tracks | Best for | Common failure |
|---|---|---|---|
| Kanban | Flow across stages, WIP, cycle time | Ongoing work with repeated steps | Vague columns and no WIP limits |
| To-do list | Intent and due dates | Small personal tasks | No visibility into waiting time |
| Gantt plan | Schedule and dependencies | Fixed-scope projects | Schedule slips hide queue buildup |
| Time blocking | Planned focus sessions | Deep work for individuals | Work still waits for reviews |
Use the checklist when you set up a board.
- Define “In progress” with a clear start condition.
- Define “Done” with a clear exit condition.
- Set WIP limits for active columns.
- Track cycle time for at least 30 cards.
- Review blocked cards with owners and dates.
- Adjust intake so WIP stays near limits.
Common mistakes
Using the board as a status report
Why it happens: teams update cards to match what they want to say, not what the system is doing. Impact: stakeholders see movement but cycle time stays high because work waits in queues off-board. How to avoid it: require timestamps for when cards enter and exit columns, then review cycle time trends instead of card counts.
Setting WIP limits too high
Why it happens: people equate higher WIP with more productivity, which feels safer during busy weeks. Impact: multitasking rises, and “In progress” becomes a backlog that hides bottlenecks. How to avoid it: start with low WIP (1–3 per person or 3–5 per team), then raise only if queues stay empty and throughput improves.
Mixing work types without policies
Why it happens: teams add cards quickly and postpone process decisions. Impact: cards bounce between columns, and rework inflates cycle time. How to avoid it: add a “Class of service” field or separate lanes for work types, then write entry/exit criteria for each lane.
Ignoring review and approval steps
Why it happens: teams treat review as a minor step, which, frankly, most people skip defining. Impact: feedback delays dominate cycle time, and the board blames “effort” instead of review capacity. How to avoid it: model review as its own column with WIP limits and a policy for what “ready for review” means.
Changing the board every week
Why it happens: teams chase improvement by reshaping columns midstream. Impact: metrics become inconsistent, so you cannot tell whether changes helped. How to avoid it: keep column definitions stable for 2–4 weeks, then adjust based on observed stalls and cycle-time data.
FAQ
How many columns should a board have?
Start with 3–5 columns: To do, In progress, Review (or Waiting), and Done. Add a column only when you see consistent waiting that deserves a separate policy, such as “Parts wait” in a service workflow. If you create 10 columns on day one, you increase classification errors and reduce the usefulness of cycle-time measurements. After 2–4 weeks, refine based on where cards spend time and where WIP limits get hit.
What does WIP limit mean in practice?
A WIP limit caps the number of cards allowed in a specific column at one time. When the limit is reached, you stop starting new work of that type and focus on finishing or unblocking existing cards. This changes behavior because it forces trade-offs: you cannot accept unlimited intake without increasing queues elsewhere. For learning tasks, WIP limits also prevent overlapping drafts that depend on the same feedback channel.
How do I measure cycle time without guessing?
Use timestamps from your board system. Define cycle time as the time from when a card enters “In progress” to when it reaches “Done.” Keep “Done” consistent, or cycle-time data mixes different quality thresholds. Track at least 30 cards before drawing conclusions, since small samples swing with one slow review. If you cannot get timestamps, you can still start by recording entry and exit dates manually for a short pilot.
Should I use Kanban for one-person work?
Kanban works for individuals when you have repeatable steps and waiting states, such as drafting then reviewing then revising. If your work has only one step, a to-do list may be enough. WIP limits still matter for solo work because they reduce multitasking, but you must define “In progress” honestly. A solo board also benefits from explicit “Done” criteria so you do not treat “draft” as completion.
When does Kanban stop helping?
Kanban stops helping when the work has no stable workflow stages, or when intake and “Done” definitions change constantly. It also fails when the team cannot act on bottlenecks, such as when review capacity is fixed and external approvals dominate. In those cases, the board may still reveal the constraint, but it cannot remove it. You may need to adjust capacity, change policies, or redesign the process before expecting cycle-time improvements.
Author's Insight
Kanban boards organize work by turning hidden queues into visible states, then forcing decisions through WIP limits and explicit policies. The board becomes useful when “In progress” and “Done” mean the same thing to everyone who moves cards. I often see improvements after teams stop adding columns and instead tighten definitions and review steps, which reduces rework. If your metrics do not change after 2–4 weeks, the issue usually sits in intake control or review capacity, not in the board layout.
Observe stalls for 14 days. Then adjust.
Key takeaways
- Define column entry and exit criteria so cards reflect the real workflow.
- Set WIP limits low enough to expose bottlenecks, then keep them stable for 2–4 weeks.
- Track cycle time and throughput from consistent timestamps, not from card counts.
- Model review, approvals, and dependencies as first-class workflow states.
- Control intake so backlog growth does not masquerade as “slow progress.”
Start with one board, one workflow, and one measurement. If you cannot measure cycle time, you cannot diagnose the system.